plotVolcano is a simple implementation and shares most of arguments
with other rliger plotting functions. plotEnhancedVolcano is a
wrapper function of EnhancedVolcano::EnhancedVolcano(), which has
provides substantial amount of arguments for graphical control. However, that
requires the installation of package "EnhancedVolcano".
highlight and labelTopN both controls the feature name
labeling, whereas highlight is considered first. If both are as
default (NULL), all significant features will be labeled.
Usage
plotVolcano(
  result,
  group = NULL,
  logFCThresh = 1,
  padjThresh = 0.01,
  highlight = NULL,
  labelTopN = NULL,
  dotSize = 2,
  dotAlpha = 0.8,
  legendPosition = "top",
  labelSize = 4,
  ...
)
Arguments
- result
Data frame table returned by
runMarkerDEGorrunPairwiseDEG.- group
Selection of one group available from
result$group. If only one group is available fromresult, defaultNULLuses it.- logFCThresh
Number for the threshold on the absolute value of the log2 fold change statistics. Default
1.- padjThresh
Number for the threshold on the adjusted p-value statistics. Default
0.01.- highlight
A character vector of feature names to be highlighted. Default
NULL.- labelTopN
Number of top differential expressed features to be labeled on the top of the dots. Ranked by adjusted p-value first and absolute value of logFC next. Default
NULL.- dotSize, dotAlpha
Numbers for universal aesthetics control of dots. Default
2and0.8.- legendPosition
Text indicating where to place the legend. Choose from
"top","bottom","left"or"right". Default"top".- labelSize
Size of labeled top features and line annotations. Default
4.- ...
Arguments passed on to
.ggScatter,.ggplotLigerThemedotOrderControls the order that each dot is added to the plot. Choose from
"shuffle","ascending", or"descending". Default"shuffle", useful when coloring by categories that overlaps (e.g. "dataset"),"ascending"can be useful when coloring by a continuous variable (e.g. gene expression) where high values needs more highlight.NULLuse default order.rasterLogical, whether to rasterize the plot. Default
NULLautomatically rasterize the plot when number of total dots to be plotted exceeds 100,000.labelTextLogical, whether to show text label at the median position of each categorical group specified by
colorBy. DefaultTRUE. Does not work when continuous coloring is specified.labelTextSizeNumeric, controls the size of label size when
labelText = TRUE. Default4.seedRandom seed for reproducibility. Default
1.legendColorTitleLegend title text for color aesthetics, often used for categorical or continuous coloring of dots. Default
NULLshows the original variable name.showLegendWhether to show the legend. Default
TRUE.baseSizeOne-parameter control of all text sizes. Individual text element sizes can be controlled by other size arguments. "Title" sizes are 2 points larger than "text" sizes when being controlled by this.
titleSize,xTitleSize,yTitleSize,legendTitleSizeSize of main title, axis titles and legend title. Default
NULLcontrols bybaseSize + 2.subtitleSize,xTextSize,yTextSize,legendTextSizeSize of subtitle text, axis texts and legend text. Default
NULLcontrols bybaseSize.panelBorderWhether to show rectangle border of the panel instead of using ggplot classic bottom and left axis lines. Default
FALSE.
Examples
defaultCluster(pbmc) <- pbmcPlot$leiden_cluster
#> ℹ Storing given cluster labels to `cellMeta(x)` field: "defaultCluster".
# Test the DEG between "stim" and "ctrl", within each cluster
result <- runPairwiseDEG(
pbmc,
groupTest = "stim",
groupCtrl = "ctrl",
variable1 = "dataset",
splitBy = "defaultCluster"
)
#> ℹ Running DEG within: "0"
#> ℹ Calling pairwise DESeq2 Wald test
#> ✔ Calling pairwise DESeq2 Wald test ... done
#>
#> ℹ Running DEG within: "1"
#> ℹ Calling pairwise DESeq2 Wald test
#> -- note: fitType='parametric', but the dispersion trend was not well captured by the
#> function: y = a/x + b, and a local regression fit was automatically substituted.
#> specify fitType='local' or 'mean' to avoid this message next time.
#> ✔ Calling pairwise DESeq2 Wald test ... done
#>
#> ℹ Running DEG within: "2"
#> ℹ Calling pairwise DESeq2 Wald test
#> ✔ Calling pairwise DESeq2 Wald test ... done
#>
#> ℹ Running DEG within: "3"
#> ℹ Calling pairwise DESeq2 Wald test
#> ✔ Calling pairwise DESeq2 Wald test ... done
#>
#> ℹ Running DEG within: "4"
#> ℹ Calling pairwise DESeq2 Wald test
#> ✔ Calling pairwise DESeq2 Wald test ... done
#>
#> ℹ Running DEG within: "5"
#> ℹ Calling pairwise DESeq2 Wald test
#> ✔ Calling pairwise DESeq2 Wald test ... done
#>
#> ℹ Running DEG within: "6"
#> ℹ Calling pairwise DESeq2 Wald test
#> ✔ Calling pairwise DESeq2 Wald test ... done
#>
#> ℹ Running DEG within: "7"
#> ℹ Calling pairwise DESeq2 Wald test
#> ! Ignoring replicates (size in bracket) with too few cells: "others.ctrl.rep1 (2)"
#> ℹ Calling pairwise DESeq2 Wald test
#> ℹ Consider decrease minCellPerRep to exclude less replicates or/and lower nPsdRep to generate larger pseudo-replicates.
#> ℹ Calling pairwise DESeq2 Wald test
#> ✖ Error when computing on "7.stim": Too few replicates with more than 3 cells (`minCellPerRep`) for condition "others".
#> ℹ Calling pairwise DESeq2 Wald test
#> ! Empty result returned for this test.
#> ℹ Calling pairwise DESeq2 Wald test
#> ✖ Calling pairwise DESeq2 Wald test ... failed
#>
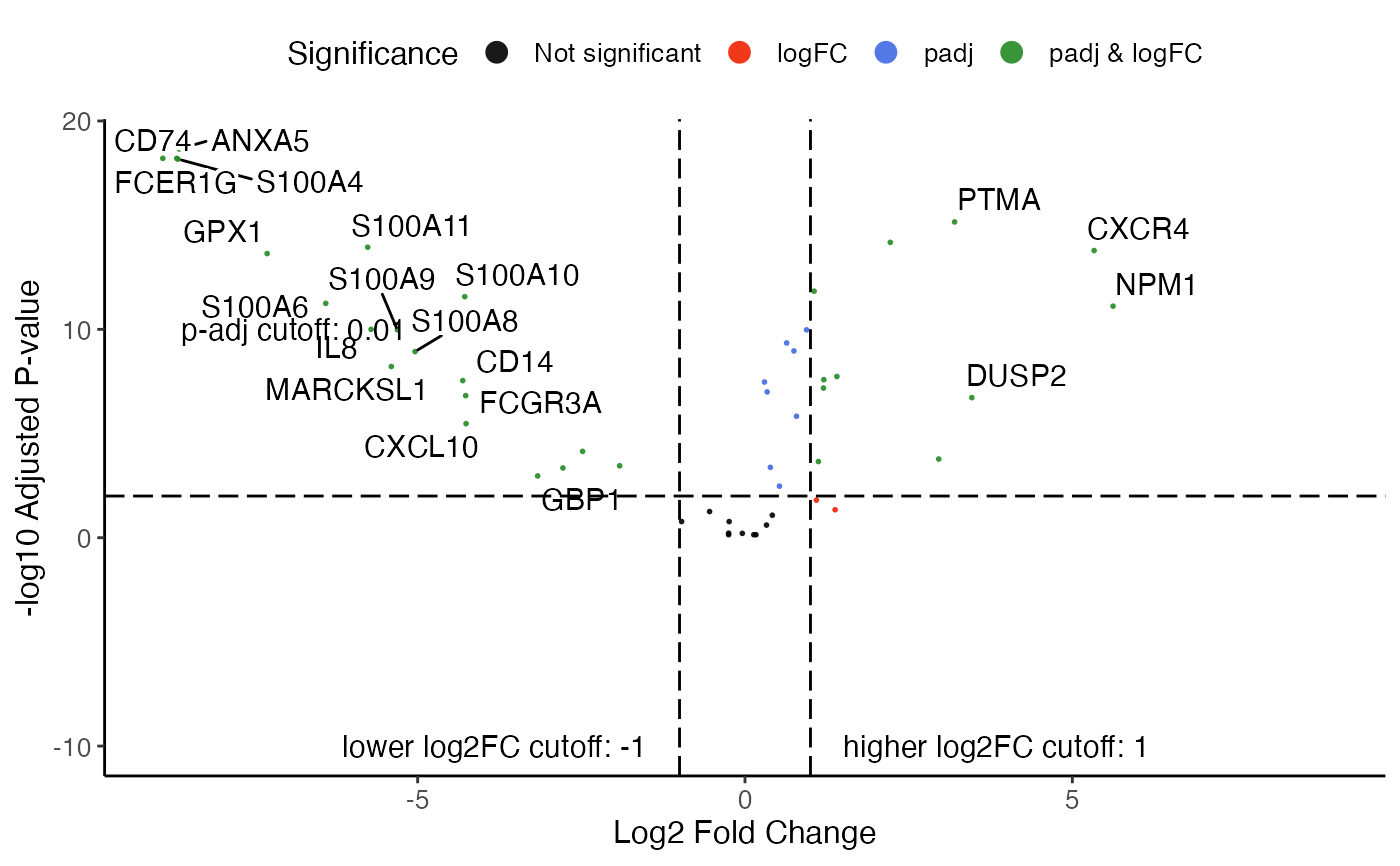
plotVolcano(result, "0.stim")
#> Warning: ggrepel: 6 unlabeled data points (too many overlaps). Consider increasing max.overlaps