Create heatmap for showing top marker expression in conditions
Source:R/DEG_marker.R
plotMarkerHeatmap.RdCreate heatmap for showing top marker expression in conditions
Usage
plotMarkerHeatmap(
  object,
  result,
  topN = 5,
  lfcThresh = 1,
  padjThresh = 0.05,
  pctInThresh = 50,
  pctOutThresh = 50,
  dedupBy = c("logFC", "padj"),
  groupBy = NULL,
  groupSize = 50,
  column_title = NULL,
  ...
)
Arguments
- object
A liger object, with normalized data and metadata to annotate available.
- result
The data.frame returned by
runMarkerDEG.- topN
Number of top features to be plot for each group. Default
5.- lfcThresh
Hard threshold on logFC value. Default
1.- padjThresh
Hard threshold on adjusted P-value. Default
0.05.- pctInThresh, pctOutThresh
Threshold on expression percentage. These mean that a feature will only pass the filter if it is expressed in more than
pctInThreshpercent of cells in the corresponding cluster. Similarly forpctOutThresh. Only applied when these metrics are available. Default50percent for both.- dedupBy
When ranking by padj and logFC and a feature is ranked as top for multiple clusters, assign this feature as the marker of a cluster when it has the largest
"logFC"in the cluster or has the lowest"padj". Default"logFC".- groupBy
Cell metadata variable names for cell grouping. Downsample balancing will also be aware of this. Default
"dataset"and the default cluster.- groupSize
Maximum number of cells in each group to be downsampled for plotting. Default
50.- column_title
Title on the column. Default
NULL.- ...
Arguments passed on to
plotGeneHeatmap,.plotHeatmapcellAnnotationdata.frame object for using external annotation, with each column a variable and each row is a cell. Row names of this data.frame will be used for matching cells involved in heatmap. For cells not found in this data.frame,
NAs will be added with warning. DefaultNULL.transposeLogical, whether to "rotate" the heatmap by 90 degrees so that cell information is displayed by row. Default
FALSE.showCellLabel,showFeatureLabelLogical, whether to show cell barcodes, gene symbols or factor names. Default
TRUEfor gene/factors butFALSEfor cells.cellAnnColList,featureAnnColListList object, with each element a named vector of R-interpretable color code. The names of the list elements are used for matching the annotation variable names. The names of the colors in the vectors are used for matching the levels of a variable (factor object, categorical). Default
NULLgenerates ggplot-flavor categorical colors.scaleLogical, whether to take z-score to scale and center gene expression. Applied after
dataScaleFunc. DefaultFALSE.trimNumeric vector of two values. Limit the z-score value into this range when
scale = TRUE. Defaultc(-2, 2).baseSizeOne-parameter control of all text sizes. Individual text element sizes can be controlled by other size arguments. "Title" sizes are 2 points larger than "text" sizes when being controlled by this.
cellTextSize,featureTextSize,legendTextSizeSize of cell barcode labels, gene/factor labels, or legend values. Default
NULL.cellTitleSize,featureTitleSize,legendTitleSizeSize of titles of the cell slices, gene/factor slices, or the legends. Default
NULL.viridisOption,viridisDirectionSee argument
optionanddirectionofviridis. Default"A"and-1.RColorBrewerOptionWhen
scale = TRUE, heatmap color will be mapped withbrewer.pal. This is passed toname. Default"RdBu".
Examples
defaultCluster(pbmc) <- pbmcPlot$leiden_cluster
#> ℹ Storing given cluster labels to `cellMeta(x)` field: "defaultCluster".
markerTable <- runMarkerDEG(
pbmc,
minCellPerRep = 5
)
#> DESeq2 Wald test ■■■■■■■■■ 25% | ETA: 3s
#> ! Ignoring replicates (size in bracket) with too few cells: "4.ctrl.rep1 (4)" and "4.ctrl.rep3 (4)"
#> DESeq2 Wald test ■■■■■■■■■ 25% | ETA: 3s
#> ℹ Consider decrease minCellPerRep to exclude less replicates or/and lower nPsdRep to generate larger pseudo-replicates.
#> DESeq2 Wald test ■■■■■■■■■ 25% | ETA: 3s
#> DESeq2 Wald test ■■■■■■■■■■■■■■■■■■■■ 62% | ETA: 2s
#> ! Ignoring replicates (size in bracket) with too few cells: "7.ctrl.rep1 (2)", "7.ctrl.rep2 (3)", and "7.ctrl.rep3 (3)"
#> DESeq2 Wald test ■■■■■■■■■■■■■■■■■■■■ 62% | ETA: 2s
#> ℹ Consider decrease minCellPerRep to exclude less replicates or/and lower nPsdRep to generate larger pseudo-replicates.
#> DESeq2 Wald test ■■■■■■■■■■■■■■■■■■■■ 62% | ETA: 2s
#> DESeq2 Wald test ■■■■■■■■■■■■■■■■■■■■■■■■■■■■■■■ 100% | ETA: 0s
pbmc <- normalize(pbmc)
#> ℹ Normalizing datasets "ctrl"
#> ℹ Normalizing datasets "stim"
#> ✔ Normalizing datasets "stim" ... done
#>
#> ℹ Normalizing datasets "ctrl"
#> ✔ Normalizing datasets "ctrl" ... done
#>
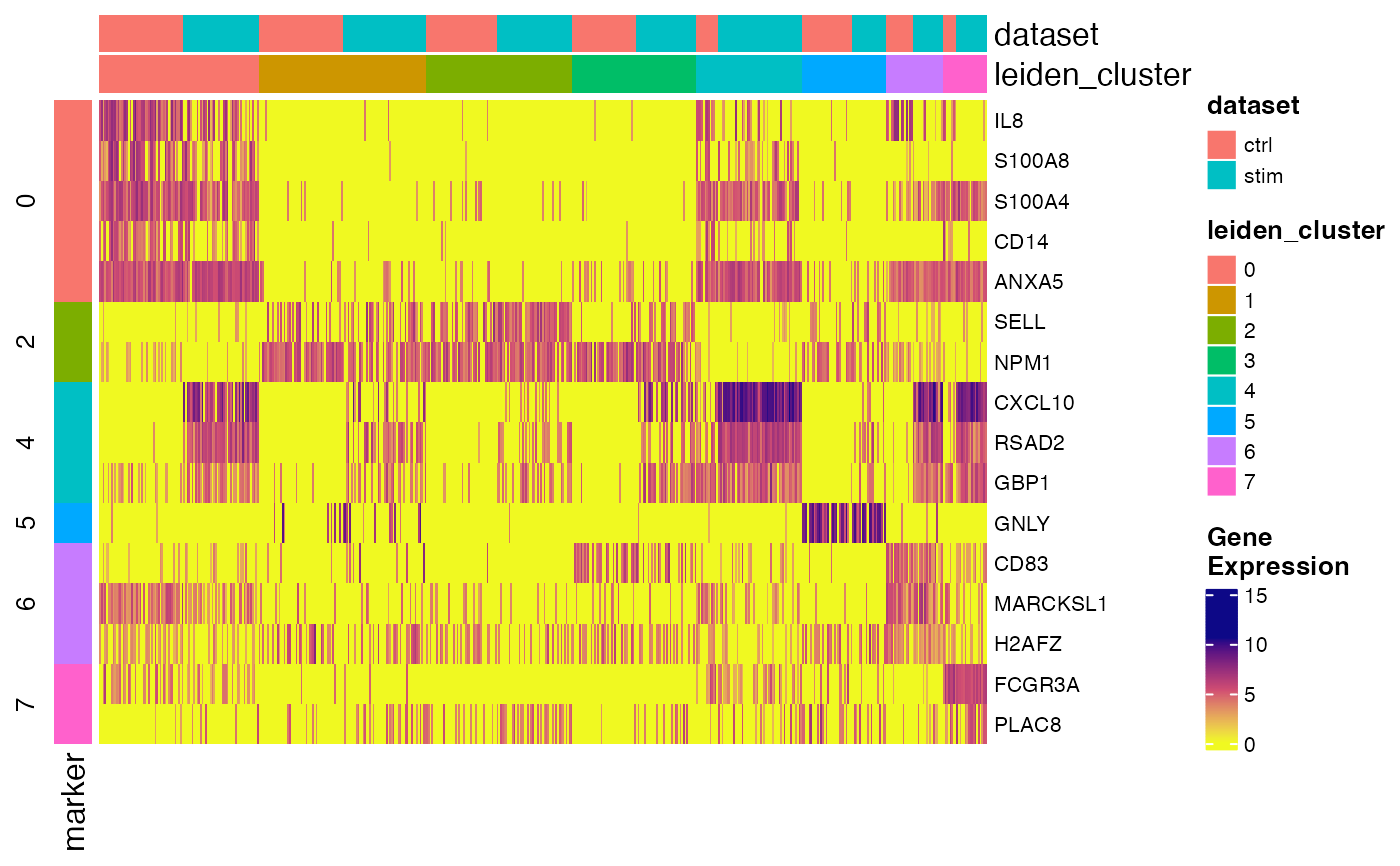
plotMarkerHeatmap(pbmc, markerTable)
#> ℹ Subsetting dataset: "ctrl"
#> ℹ Subsetting dataset: "stim"
#> ✔ Subsetting dataset: "stim" ... done
#>
#> ℹ Subsetting dataset: "ctrl"
#> ✔ Subsetting dataset: "ctrl" ... done
#>